An essay
Snow Past the Window
How much had to be true for one ordinary snowy evening.
Play
Short on time? Take the five-minute tour
- How many galaxies are there? Galaxy counts range from a few hundred billion seen to about two trillion modelled; the gap is about where you stop calling a clump of stars a galaxy.
- How far away is the Sun, and why is that distance right? Earth is about 150 million kilometres from the Sun, and sunlight takes a little over eight minutes to cross that gap. Game: How much would you weigh on Mars? Game: Is this planet in the right place?
- Why do the Sun and the Moon look the same size? The Sun is about 400 times wider than the Moon and about 390 times farther away, so they look nearly the same size in our sky. Game: Can you make an eclipse?
- What protects us from the Sun? Earth's magnetic field, the whole atmosphere and a thin ozone layer each take part in shielding the ground from the Sun.
- Why has Earth not frozen or boiled? Earth has kept liquid water while the Sun brightened, and a slow cycle of carbon through rock, rain and volcanoes is the best explanation.
- Why is there winter, and what is snow? Winter is not caused by distance: the Earth is nearest the Sun in early January, and the gap between nearest and farthest is only about 3 percent. Game: Draw a snowflake
- How long would it take to reach Proxima Centauri? The nearest known star, Proxima Centauri, is about 4.2465 light-years away, roughly 40 trillion kilometres. Game: How long to the nearest star?
- How likely is it that we are alone? The honest answer to how likely we are is that the data cannot yet say.
- The numbers that could have been different Physics needs numbers fed in that the theory does not explain; they were measured.
- Who or what made it? Nobody has settled whether anything made the world; the essay sets out five families of answer and argues for none.
- What do you do with all of this? The suggestion is small: next time it snows, watch one flake all the way down.
Stand at a window on a night when it snows.
The glass is cold. Past it, in the lamplight, the flakes come down slowly, each one lit for a moment and then gone. That water was part of a cloud not long ago. Sooner or later it will be water again, running somewhere. For now it is simply falling, and you are simply watching, and nothing else is asked of either of you.
Now look past the lamp. That dark is not empty. The few stars you can see are light that left them years, centuries, or for the farthest, more than a thousand years ago, and it has arrived just now, at this window, at your eye.
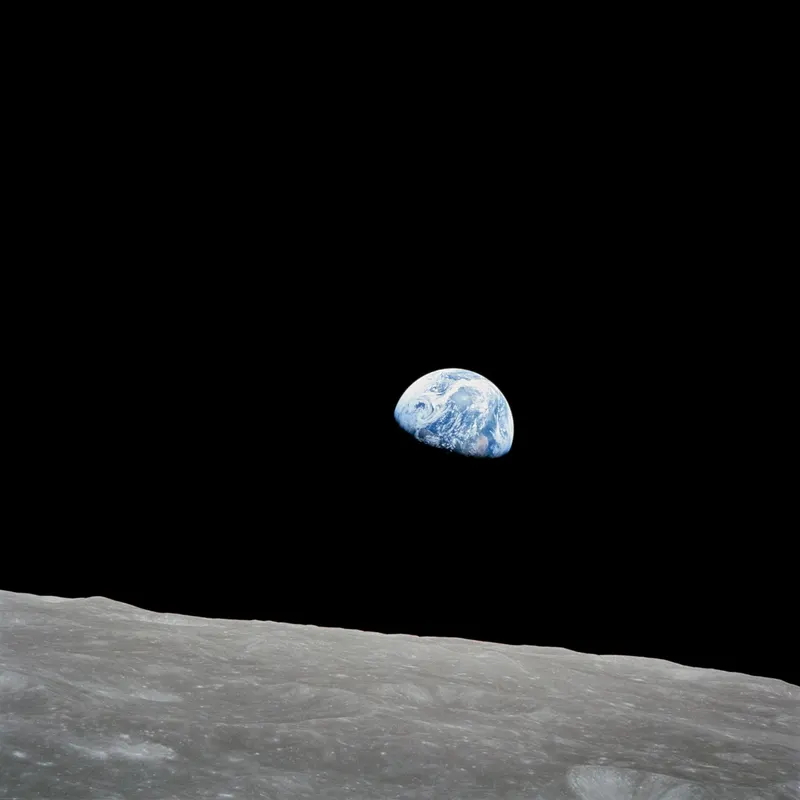
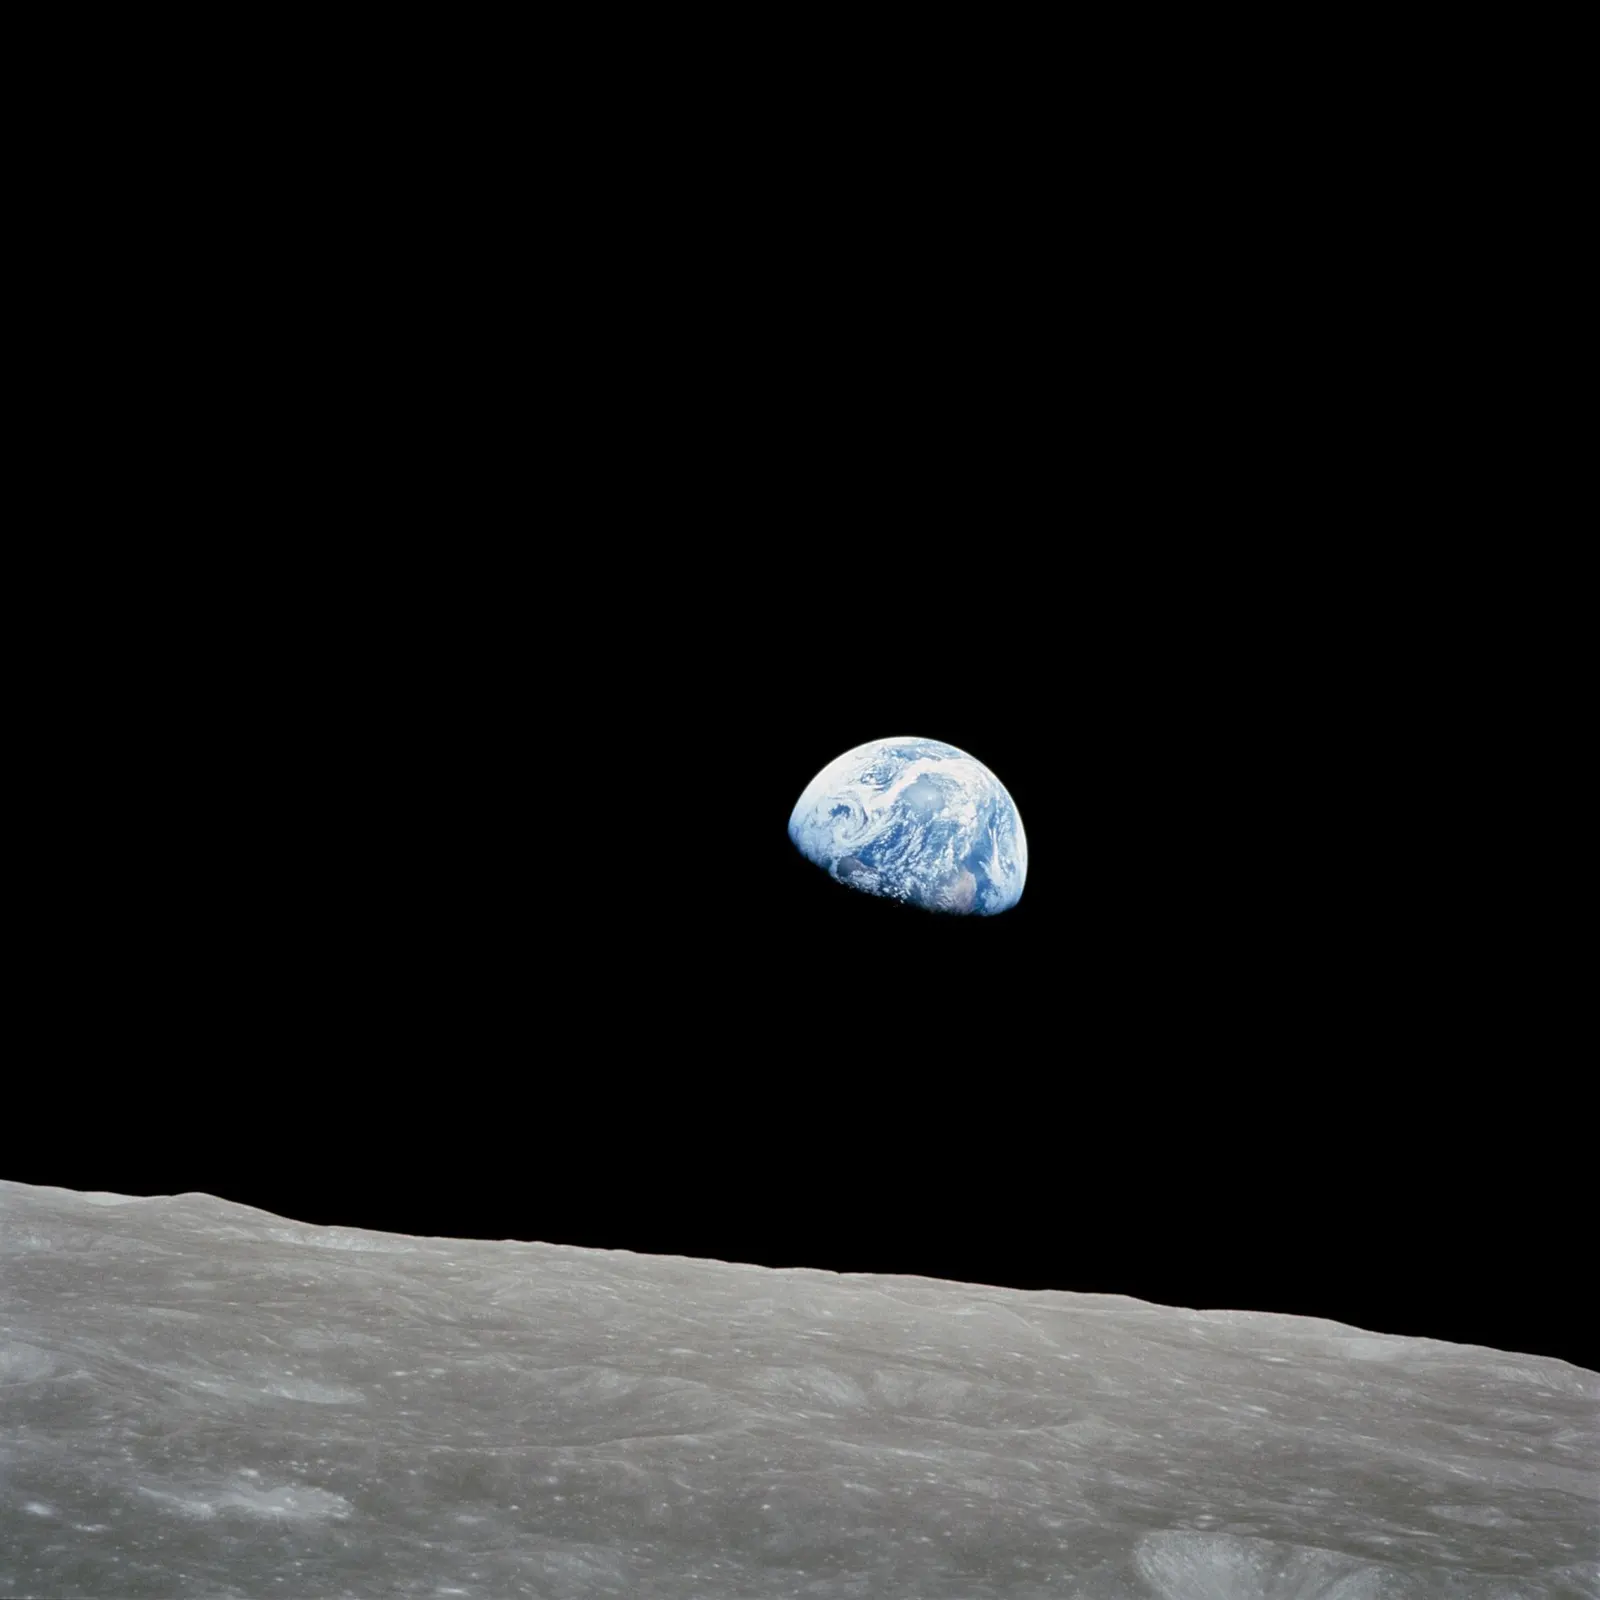
On Christmas Eve 1968, three men were in orbit around the Moon, aimed at the Moon, busy with the Moon. They had gone there to look at the places where people would land next.
Then, through a window, something else came up over the grey horizon: a small blue and white ball, hanging in black. Someone went looking for a roll of colour film. The photograph that came out of it is called Earthrise.
They had come for the Moon. What they found was a lit window, seen from the outside, with everyone we have ever known inside it.
I want to take that ordinary moment seriously for the next few thousand words. Not because it is rare, but because of how much had to be true for it to happen at all, and how much of that we only half understand.
How many galaxies are there?
Start with the largest thing we can say anything about.
Light is fast, but it is not instant. When we look at a distant galaxy, we see light that left it long ago. The universe has a finite age, about 13.8 billion years by the best current measurement, so there is a limit to how far light can have travelled to reach us. Everything inside that limit is what astronomers call the observable universe.
It is a sphere, and we are at its centre. That is not because we are special. Anyone, anywhere, would find themselves at the centre of their own.
You might expect its radius to be 13.8 billion light years. It is larger, about 46 billion light years, because space kept stretching while the light was on its way. The oldest light we catch left its source when that source was much closer. Today, the matter that sent it is much farther away.
Climb the ladder of distances
Simplified Each step up is ten times farther.
Slide to zoom out from one metre. Each mark on the scale is ten times the last.
- One metrea long step1 × 100 m
- Across the Earth12,756 km1.28 × 107 m
- To the Moonaverage distance, 384,400 km3.84 × 108 m
- To the Sun1 AU, about 149.6 million km1.50 × 1011 m
- To Voyager 1about 164.7 AU, as of 21 August 20242.46 × 1013 m
- To Proxima Centaurinearest star, about 4.2465 light years4.02 × 1016 m
- Across the Milky Wayabout 100,000 light years9.46 × 1020 m
- To Andromedaabout 2.5 million light years2.37 × 1022 m
- To the edge of what we can seeabout 46 billion light years4.35 × 1026 m
Everything shown: out to 1026.6 metres.
The scale is logarithmic, so equal gaps on screen are equal factors of ten, not equal distances. In a straight-line scale, every rung except the last would sit on top of the zero mark. The last rung is the edge of what we can see, not the edge of the universe.
What it shows / what it leaves out
What it shows:
- Nine real distances, each from one metre to the observable universe, on one scale.
- How many factors of ten separate them: the Moon is about 108 m, the edge of what we can see about 1026 m.
What it leaves out:
- The Sun and Voyager 1 distances change with time. Voyager 1 is shown at its last NASA figure read here, dated, and is farther now.
- The size of the observable universe depends on the cosmological model; it is shown to two figures, as "about 46 billion". It is a radius measured today, not a distance light has travelled.
- Proxima's distance is 4.2465 light years from the Gaia parallax; NASA's Exoplanet Archive lists about 4.2439. Both round to 4.2.
- Empty space between the rungs: no other objects are drawn.
- Earth: NASA NSSDC Earth fact sheet (equatorial radius 6,378.137 km; semimajor axis 149.598 million km), accessed 2026-11-08.
- Moon: NASA NSSDC Moon fact sheet (mean distance 384,400 km), accessed 2026-11-08.
- Voyager 1: NASA, Voyager 1 ("as of Aug. 21, 2024, Voyager 1 was 164.7 AU from Earth"), accessed 2026-11-08.
- Proxima Centauri: ESA Gaia DR3 parallax 768.07 mas, Gaia archive, accessed 2026-11-08; 1 / 0.76807 arcsec = 1.302 parsecs = 4.2465 ly.
- Milky Way: NASA Science, Our Milky Way Galaxy: How Big is Space? ("about 100,000 light-years across"), accessed 2026-11-08.
- Andromeda: NASA Science, Andromeda galaxy ("approximately 2.5 million light-years away"), accessed 2026-11-08.
- Observable universe: Planck Collaboration 2018, arXiv:1807.06209 (H0 = 67.4 km/s/Mpc, Ωm = 0.315), comoving radius about 46 billion ly computed on this site, accessed 2026-11-08.
- 1 light year = 9.4607 × 10¹² km. Metres are worked out in this page from the figures above.
Teaching text: CC BY 4.0, Marco Diversi, 2026. Code: MIT. Nothing leaves this page or is stored.
How much is in there?
In 2016, Christopher Conselice and colleagues took the deepest Hubble images, counted the galaxies, and modelled how many must be too small and faint to see. Their answer was about two trillion galaxies, roughly ten times more than we can actually detect. That number travelled around the world.
Then a spacecraft gave a second opinion. New Horizons, after passing Pluto, was far enough from the Sun to measure the faint glow of the whole sky without the dust of the inner solar system in the way. That glow is the sum of the light of every galaxy, seen and unseen. In 2021, Tod Lauer and colleagues reported that it was brighter than known galaxies could explain. Some news stories turned this into “only a few hundred billion galaxies”. The release behind those stories was later corrected: the measurement constrains total light, not the number of galaxies.
The story kept moving. A newer New Horizons analysis, led by Marc Postman and published in 2024, found that once you account for the galaxies carefully, the leftover glow is no longer significant. The simplest reading is that the background light is just galaxies.
So how many are there? I can give you a range, and an honest reason for it. A few hundred billion is roughly what we can see. Two trillion is what one careful model says exists, if you count galaxies down to a certain small size. Count smaller ones and the number grows. The disagreement is not about the sky. It is about where you stop calling a clump of stars a galaxy.
Stars are harder still. Our own galaxy, the Milky Way, holds somewhere between about 100 and 400 billion of them. The range is wide because nobody has counted them one by one; the total is estimated from the galaxy’s mass and brightness.
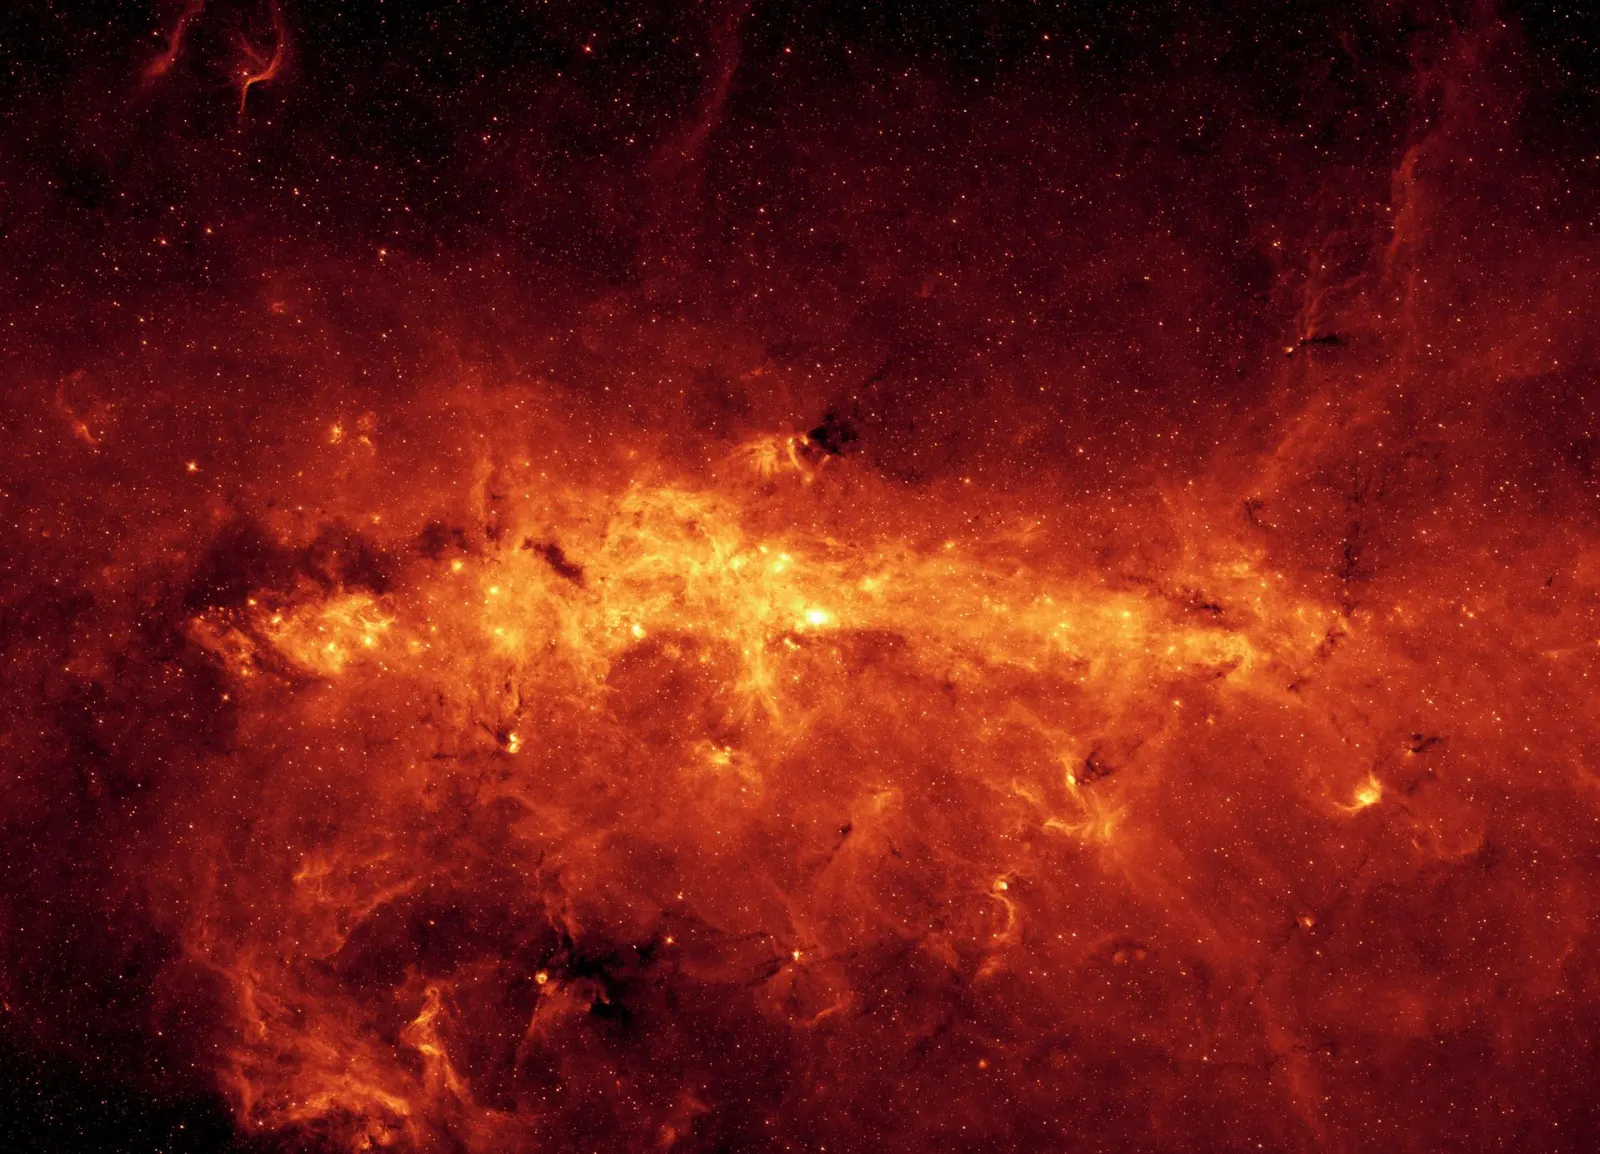
For the whole observable universe, you will often see a figure between 10^22 and 10^24 stars, a one followed by twenty-two to twenty-four zeros. Nobody counted them. That number comes from multiplying a rough number of stars per galaxy by a rough number of galaxies. It is an order of magnitude, not a measurement, and I would rather tell you that than pretend.
What I find moving here is not the size of the numbers. It is that we know their uncertainty. We know which part is counted, which part is modelled, and where the argument is. A species that worked out how far the light has come also worked out how sure it can be.
And at the edge, the knowing stops. The observable universe is limited by time, not by the universe itself. Beyond the edge there is almost certainly more, but no light from there has reached us yet. We do not know how much more. We do not even know whether the question “how many galaxies are there, in total?” has a finite answer.
How far away is the Sun, and why is that distance right?
Come back in. Past the galaxies, past the Milky Way, to one ordinary star.
The Sun is about 150 million kilometres away. Earth’s orbit is slightly oval, so the distance swings between about 147 and 152 million kilometres over the year. Sunlight takes a little over eight minutes to cross that gap. When you feel it on your face, you are feeling something that left the Sun before you finished reading the last paragraph.
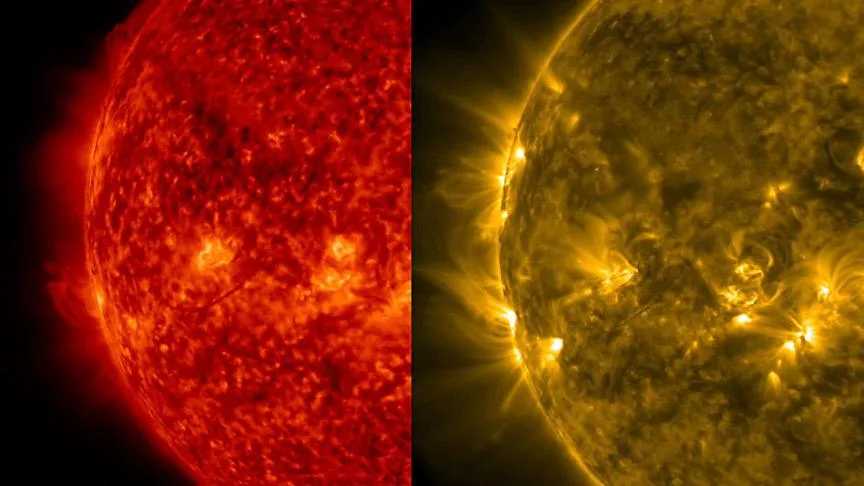
That distance matters more than almost anything else in this essay.
Astronomers use the phrase “habitable zone” for the band around a star where a planet like Earth could keep liquid water on its surface. Too close, and water boils off. Too far, and it freezes, or the planet cannot hold enough warming gases to stay thawed.
The best known calculation for our Sun comes from Ravi Kopparapu and colleagues in 2013. Building on earlier work by James Kasting and colleagues, they put the inner edge at about 0.99 times Earth’s distance from the Sun and the outer edge at about 1.70 times. Kasting’s earlier, more conservative estimate was 0.95 to 1.67.
Look at the inner number again. In that model, Earth sits right at the inner edge, with almost no margin. A 2013 three-dimensional climate model, which handles clouds and humidity better, found that a planet like Earth can take more sunlight than the older one-dimensional models allowed before running away into a steam atmosphere. That would give Earth more room than this calculation suggests.
Our two neighbours show what the edges look like.
Venus orbits at about 0.72 times our distance. Its surface averages about 464 degrees Celsius, under an atmosphere about 92 times the pressure of ours.
Mars orbits at about 1.52 times our distance. Its average temperature is around minus 60 degrees Celsius, and the air at its surface is less than one per cent as thick as ours. Water there today is found as ice just under the surface near the poles, and as salty brine that seasonally runs down some slopes.
Weigh yourself on other worlds
Simplified A scale, a number, five worlds.
Set your weight. See what a scale would read on each world.
- Earth9.82 m/s², 1.000 × Earth30.0 kg
Home. Your scale reads what you typed.
- Moon1.62 m/s², 0.165 × Earth4.9 kg
- Mars3.73 m/s², 0.380 × Earth11.4 kg
- Venus8.87 m/s², 0.903 × Earth27.1 kg
You could not stand here: about 464 °C and 92 bars at the surface.
- Jupiter25.92 m/s², 2.640 × Earth79.2 kg
No ground to stand on: this is gravity at the 1-bar cloud level.
Your mass, how much you are made of, is the same everywhere. A scale measures the pull of gravity on that mass, so its reading changes from world to world. Like a shop scale, this page shows the reading in kilograms or pounds.
What it shows / what it leaves out
What it shows:
- The reading is your mass times the world's surface gravity, divided by Earth's.
- Gravity at the surface of the Moon is about a sixth of Earth's; at Jupiter's cloud level it is about two and a half times.
What it leaves out:
- Venus has no place to stand, and Jupiter has no ground at all. These are readings, not destinations.
- Gravity changes a little with place on each world (for example at a pole or the equator). Mean values are used.
- NASA's Moon sheet divides by 9.80 and its planet sheets by 9.82. This page uses 9.82 for all, a difference of 0.2 percent for the Moon.
- Surface gravity, NASA NSSDC planetary fact sheets, accessed 2026-11-08: Earth (9.82), Moon (1.62), Mars (3.73), Venus (8.87), Jupiter (25.92, at 1 bar), all in m/s². Pages last updated by NASA: Earth 15 Nov 2024, Moon 11 Jan 2024, Venus 11 Jan 2024, Mars 19 May 2025, Jupiter 2 Oct 2024.
- Venus surface 737 K (464 °C) and 92 bars: same Venus sheet, accessed 2026-11-08. Pound conversion: 1 kg = 2.20462 lb.
Teaching text: CC BY 4.0, Marco Diversi, 2026. Code: MIT. Nothing you type leaves this page or is stored.
Try the next game: Can you make an eclipse?We sit between them. It is tempting to call that luck, and maybe it is. But here is a complication I did not expect when I started reading.
Find the right planet
Simplified model Distance from the Sun only.
Drag the planet along the line, or use the left and right arrow keys. Is water steam, liquid, or ice?
In this model the band for liquid water runs from 0.99 to 1.70 times Earth's distance from the Sun. Its edges are soft: the model leaves out clouds, so the real edges may lie further out in both directions. Being inside the band is not a promise of water or life.
What it shows / what it leaves out
What it shows: how a planet's distance from its star changes whether water could stay liquid on its surface.
What it leaves out: the atmosphere, clouds, planet size, magnetic field, water supply and history. This is why Mars, which the model places inside the band, is cold and dry today. The real planets' numbers are NASA's measurements, shown beside the model, not worked out by it.
- Band: Kopparapu et al. 2013, "Habitable Zones Around Main-Sequence Stars: New Estimates", ApJ 765, 131, arxiv.org/abs/1301.6674, accessed 2026-11-08 (water-loss limit 0.99 AU, maximum-greenhouse limit 1.70 AU for the Sun; cloud-free 1-D model).
- Planets: NASA NSSDC fact sheets for Venus, Earth and Mars, accessed 2026-11-07.
Teaching text: CC BY 4.0, Marco Diversi, 2026. Code: MIT.
The Sun has not always been this bright. Models of how stars like the Sun age say that early in Earth’s history, our planet received about a quarter less energy from it than today. With everything else unchanged, that would have frozen the whole planet for its first two billion years. Yet the rocks say there was liquid water, and life, much earlier than that.
This is called the faint young Sun problem, and it has been argued about for more than four decades. Most proposed answers involve more greenhouse gases in the early atmosphere. None is fully agreed. A recent review states plainly that the problem cannot be regarded as solved.
So “the right distance” is not a fixed fact. The Sun brightened, and Earth’s atmosphere changed, and the two somehow kept pace for billions of years. Being in the right place was not enough. The planet also had to adjust. Section 6 is about how it may have done that.
The edges of the habitable zone are outputs of computer models, and the models are only as good as what goes into them. Kopparapu’s team left clouds out of their calculation, and noted that the true edges may lie further out. Clouds are one of the hardest things to model. We do not know exactly where the edges of our own habitable zone are, or how close to one of them we are living.
Why do the Sun and the Moon look the same size?
On some nights the Moon is so bright that it makes shadows in the snow.
Here is the strange thing about it. The Sun is about 400 times wider than the Moon. It is also about 390 times farther away. Those two numbers nearly cancel, so from Earth the Sun and the Moon look almost exactly the same size in the sky, both about half a degree across.
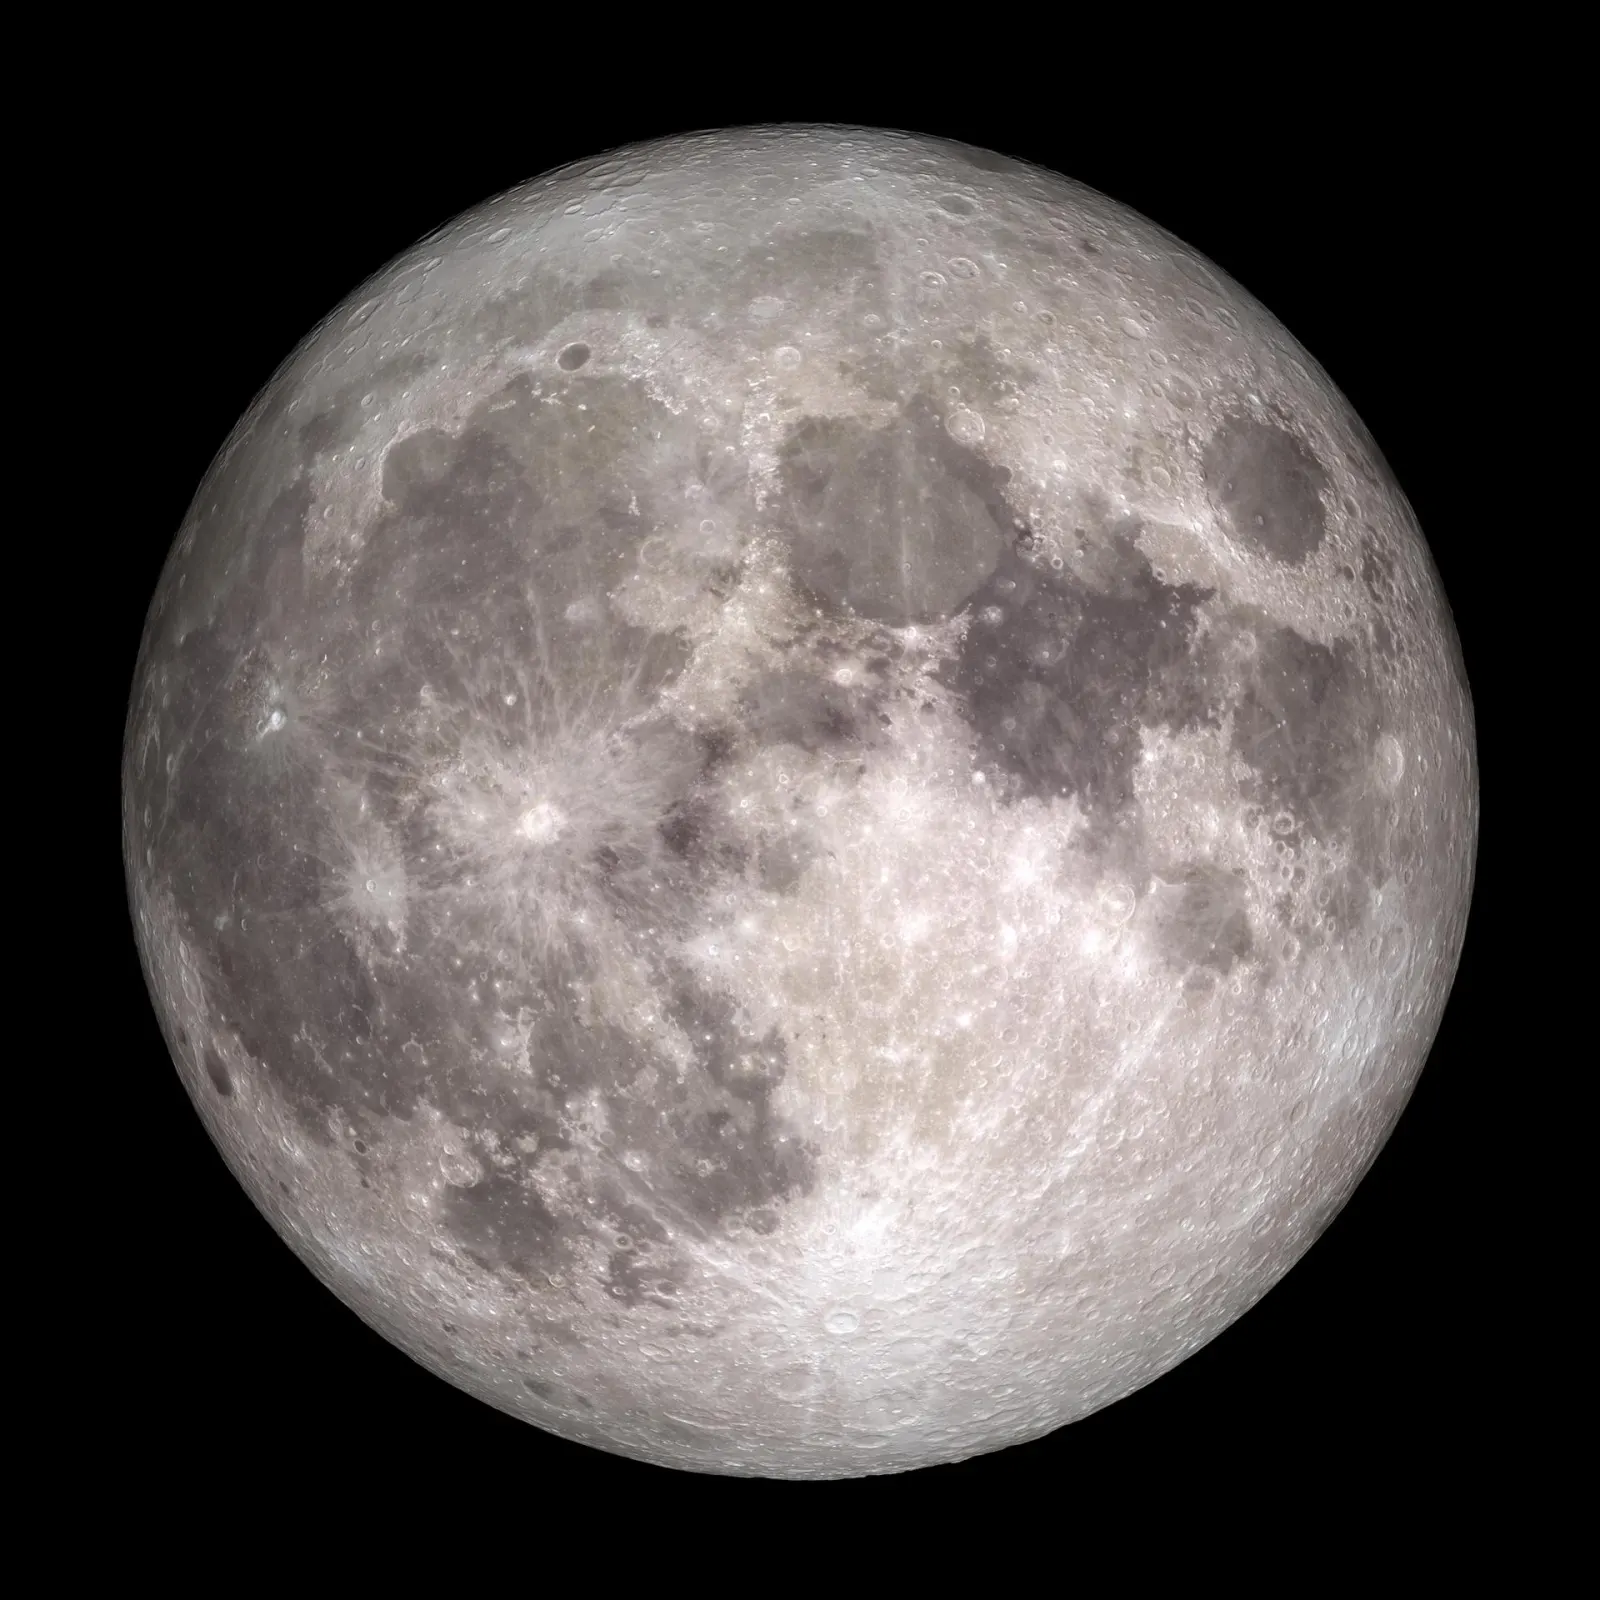
That near match is why total solar eclipses look the way they do. The Moon can cover the bright disk of the Sun exactly, leaving only the thin, pale outer atmosphere, the corona, visible around a black circle.
It is not a perfect match, and the imperfection is part of the story. The Moon’s orbit is not a circle. When it is at its closest, it looks slightly bigger than the Sun, and an eclipse can be total. When it is at its farthest, it looks slightly smaller, and we get an annular eclipse instead, with a ring of sunlight left showing around the edge.
Make an eclipse
Simplified A straight-on view from Earth.
Drag the Moon across the Sun. Or press the left and right arrow keys.
Total eclipse: the Moon covers the whole Sun.
- Moon
- Sun
Never look at the Sun without proper eclipse glasses. Real eclipse safety: NASA, Eclipse Viewing Safety.
The Sun is about 400 times wider than the Moon and about 400 times farther away, so they look almost the same size. Whether you get a total or a ring depends on how far away the Moon is that day.
What it shows / what it leaves out
What it shows:
- How wide the Sun and the Moon look from Earth, worked out from their real sizes and distances.
- Total (Moon bigger), annular (Moon smaller) and partial (Moon only part way across).
What it leaves out:
- The Moon here slides along a straight line through the Sun's centre. A real path can miss the centre, and the Moon is not always lined up with the Sun at all.
- Distances run from Earth's centre. Where you stand changes the Moon's distance by up to about 6,400 km, and the shadow only reaches a narrow strip of Earth.
- Perigee and apogee are NASA's mean values; the real distance ranges from about 357,000 to 407,000 km. Sun distance is a yearly cycle, set here by hand.
- No corona, no sky darkening, no timing: the Moon's real motion takes hours.
- Moon, NASA NSSDC fact sheet, accessed 2026-11-08, last updated by NASA 11 January 2024: nssdc.gsfc.nasa.gov/planetary/factsheet/moonfact.html (radius 1,737.4 km; mean perigee 363,300 km, mean apogee 405,500 km, mean distance 384,400 km, range about 357,000 to 407,000 km).
- Sun, NASA NSSDC fact sheet, accessed 2026-11-08, last updated by NASA 9 May 2024: nssdc.gsfc.nasa.gov/planetary/factsheet/sunfact.html (radius 695,700 km; distance from Earth 147.1 to 152.1 million km, mean 149.6). Earth sheet, semimajor axis 149.598 million km: earthfact.html.
- The "about 400 times" match: NASA Science, Why Do Eclipses Happen?, accessed 2026-11-08. Angle across = 2 × arctan(radius ÷ distance), worked out on this page.
Teaching text: CC BY 4.0, Marco Diversi, 2026. Code: MIT. Nothing leaves this page or is stored.
Try the next game: How long to the nearest star?And the match is temporary. The Moon is drifting away from us by about 3.8 centimetres a year. We know this because the Apollo astronauts left reflectors on the lunar surface, and observatories on Earth have been bouncing laser pulses off them for decades, timing the round trip.
As the Moon recedes, it will look smaller. One day it will no longer be able to cover the Sun completely, anywhere on Earth. When? Published estimates run from about 600 million years, when total eclipses begin to become rare, to over a billion years for the very last one. The most cited calculations are the eclipse expert Jean Meeus’s, as reported by Sky & Telescope and Eos. They are calculations, not measurements, and the rate of recession has not been constant over Earth’s history, so I would treat any single date as a guess.
We happen to live in the window when total eclipses happen. That is a true sentence. I do not know what to make of it, and I am wary of making too much of it.
The Moon also moves the sea. Both the Moon and the Sun raise tides, but the Moon’s pull on the oceans is roughly twice the Sun’s, because it is so much closer.
Then there is a bigger claim, and here scientists disagree.
Earth’s axis is tilted about 23.4 degrees. The tilt gives us seasons, which I will come back to. Over time, the tilt wobbles a little, between about 22 and 24.5 degrees.
In 1993, Jacques Laskar and colleagues published a result in Nature that became famous. Their calculations suggested that without the Moon, Earth’s tilt could wander chaotically anywhere between about zero and 85 degrees. A planet whose axis can lie almost on its side would have wild climate swings. The Moon, in this picture, is a stabiliser, and maybe a precondition for complex life.
Twenty years later, the picture got more complicated. Jack Lissauer, Jason Barnes and John Chambers ran long simulations of a moonless Earth. They found that the tilt did wander, but much more slowly and within a narrower band than the earlier work implied: typically a range around 20 to 25 degrees wide over hundreds of millions of years. In their runs, a moonless Earth never reached more than about 65 per cent of the full range Laskar’s method allowed. They concluded that a large moon may not be needed to keep the tilt steady over the time it takes complex life to develop. Gongjie Li and Konstantin Batygin reached a similar view in 2014: the chaotic drift is slow enough that it need not rule out a habitable planet.
Both results are careful work. They differ in method and in what they measure. The first shows where the tilt could go eventually. The second shows how fast it would get there.
So I hold two thoughts at once. The Moon steadies Earth’s tilt today; that part is not in dispute. Whether that steadiness was necessary for us to be here is an open question. We do not know how much the Moon mattered for life on Earth, and we do not know how common large moons like ours are around other rocky planets.
What protects us from the Sun?
Nothing about a quiet snowy evening suggests that we are under fire. We are, all the time.
The Sun blows a constant wind of charged particles, mostly protons and electrons, out through the solar system at more than a million miles an hour, roughly 450 kilometres every second. On top of that steady wind come gusts: flares and huge clouds of magnetised gas thrown off the Sun’s surface. From farther away, from outside the solar system, come cosmic rays, even more energetic particles. And in the sunlight itself there is ultraviolet light, energetic enough to damage living cells.
Between all that and us there are layers.
The first is Earth’s magnetic field. It reaches far out into space and steers most of the charged particles of the solar wind around the planet, the way a stone in a stream turns the water.
The second is the atmosphere, all of it. Every particle that gets past the magnetic field has to push through all that air before it reaches the ground. The weight of the atmosphere above each square metre equals about ten metres of water.
The third is thin and specific: ozone. In the stratosphere, between about 11 and 50 kilometres up, a small amount of ozone gas absorbs most of the Sun’s ultraviolet radiation before it reaches us.
Why that matters comes down to one molecule. DNA readily absorbs ultraviolet light in the band called UV-B. When it does, two neighbouring letters of the genetic code can bond to each other instead of to their partners across the ladder, making a kink that the cell’s machinery cannot read. Cells have evolved repair enzymes that cut out the damage and rebuild it. But repair has limits, and the ozone layer keeps the load manageable. NASA’s own summary is blunt: without it, life as we know it would not exist.
Now the beautiful part.
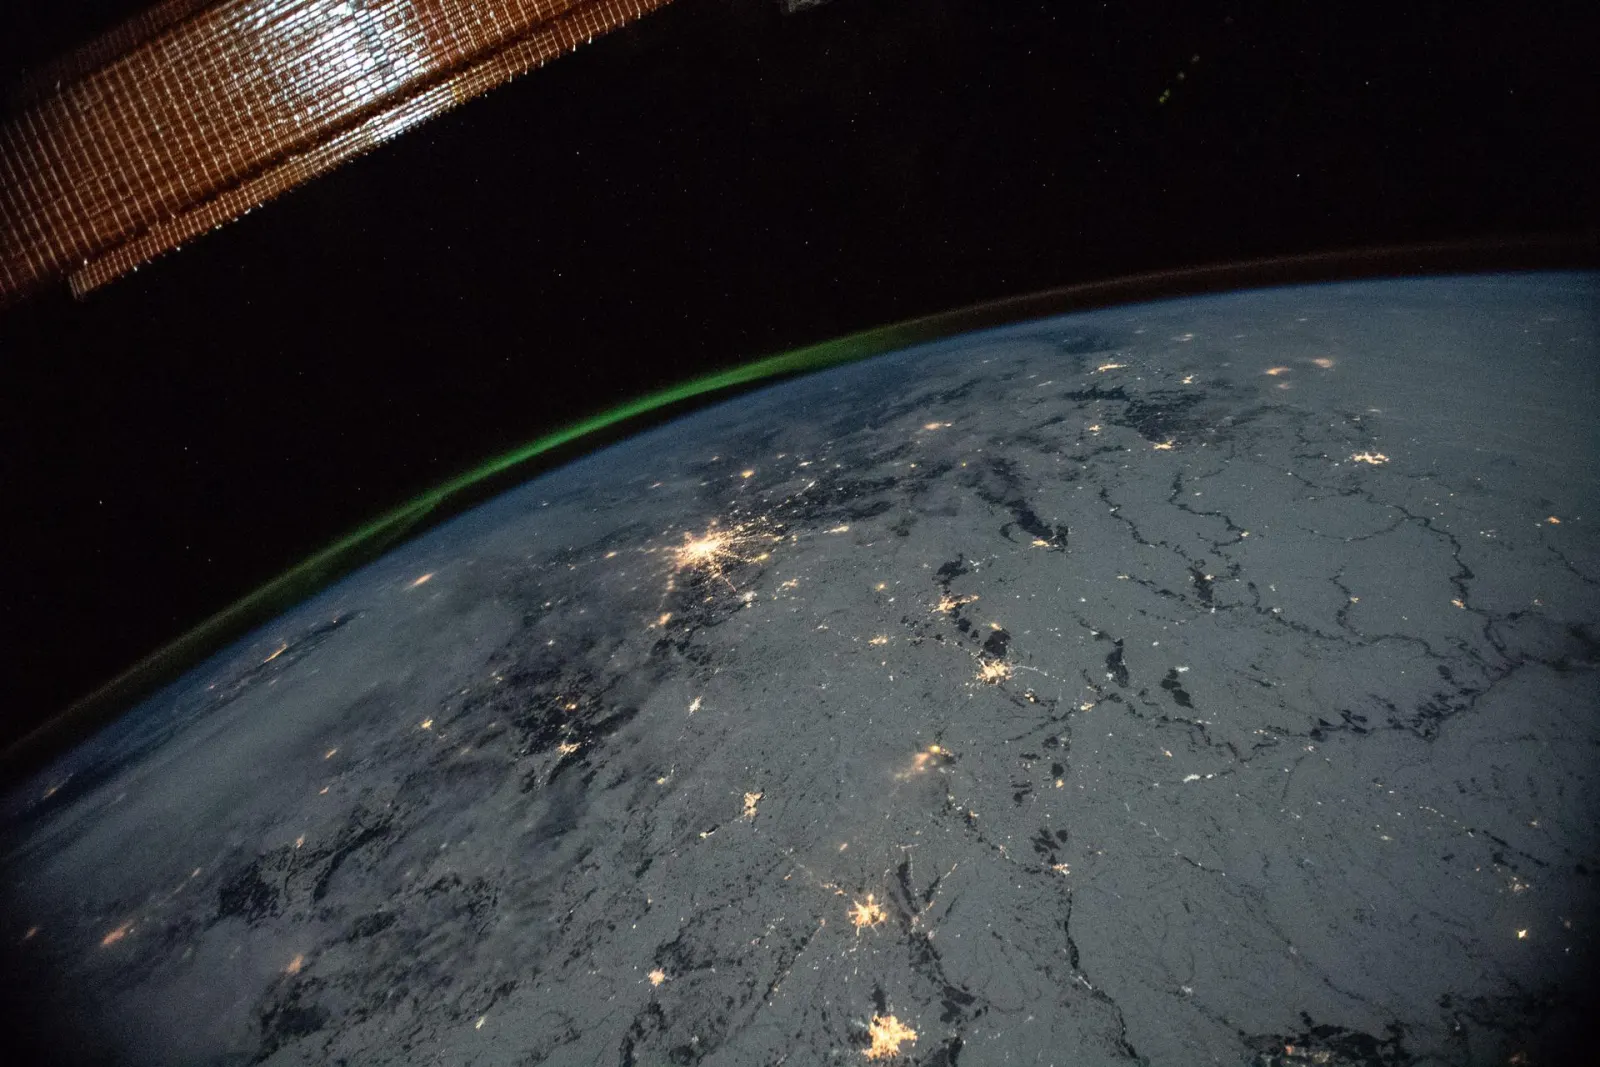
Some charged particles do get in, guided down the magnetic field lines near the poles. There they collide with oxygen and nitrogen high in the atmosphere, and those atoms give back the energy as light. That light is the aurora. It forms roughly 80 to 500 kilometres above the ground, far above any aircraft, far above any person watching.
So when you see an aurora, you are seeing the shield at work: particles that were caught, steered, and stopped high overhead. It forms far above anything on the ground.
The shield is very good. It is not perfect.
On 1 September 1859, the English astronomer Richard Carrington was observing the Sun when he saw a flare on its surface. Just before dawn the next day, what NASA and NOAA both describe as the strongest geomagnetic storm on record hit Earth. Auroras were seen as far toward the equator as Cuba and Hawaii. Telegraph systems, the high technology of the time, failed. Operators were shocked by sparks, and some equipment caught fire.
In 1859 that was a curiosity. Now we run on wires and satellites.
A smaller storm, in March 1989, collapsed the Hydro-Québec power grid in Canada in under two minutes and left around six million people without power for about nine hours.
What would a Carrington-sized storm do today? This is where I have to be careful, because the most quoted numbers are scenarios, not forecasts. A 2008 US National Research Council workshop report included one estimate of 1 to 2 trillion dollars in costs in the first year, with recovery taking 4 to 10 years. That figure came from one consultancy’s model of the US grid, and later researchers have criticised it as too pessimistic. What is agreed: power grids, satellites and navigation systems are vulnerable, and nobody knows exactly how vulnerable.
How likely is it? Estimates disagree by about ten times. One 2012 study put the chance of a Carrington-class storm in a given decade at about 12 per cent. A 2019 study, using a different statistical model, put it at roughly 0.5 to 2 per cent. Both are honest attempts with very few large events to learn from.
Leave the shield and the numbers change.
Radiation dose is measured in millisieverts. One millisievert is about the dose of ten chest X-rays. On the ground, the average person receives about three millisieverts a year or less from natural sources. On the International Space Station, which orbits inside the magnetic field but above the atmosphere, NASA’s recent estimates put the dose at roughly 0.2 to 0.5 millisieverts a day. Outside the magnetic field, on the way to Mars, NASA’s Curiosity rover measured about 1.8 millisieverts a day. A round trip to Mars at that rate would add up to about 660 millisieverts, before any time on the surface.
On the ground, under all the layers, the dose for a whole year is about what deep space delivers in a day or two.
Two things remain uncertain. First, we do not know how often Carrington-scale storms happen; the record is short and the estimates disagree. Second, scientists debate how much a magnetic field matters for keeping a planet habitable over billions of years. Some argue a field protects an atmosphere from being stripped away; others have shown that a magnetised planet can lose its atmosphere too. That the field shields life at the surface from energetic particles is not in doubt. Whether a planet needs one to have life at all, we do not know.
Why has Earth not frozen or boiled?
Remember the faint young Sun. Earth had liquid water when the Sun was weaker, and it has kept liquid water while the Sun brightened. Something has been adjusting the planet’s temperature for a very long time.
The oldest evidence is a tiny crystal. In 2001, Simon Wilde and colleagues reported a grain of zircon from the Jack Hills of Western Australia, dated to about 4.4 billion years ago. The chemistry of its oxygen suggested that the rock it formed from had been in contact with liquid water near the surface. If that reading is right, there was liquid water at Earth’s surface very early in its history. The interpretation is debated, but it is the oldest hint we have.
The best explanation for how the planet has kept its temperature since then is slow, and it involves rock.
In 1981, James Walker, Paul Hays and James Kasting proposed a thermostat. It works like this.
Carbon dioxide in the air dissolves in rain, making it slightly acidic. That rain slowly dissolves certain rocks, silicate rocks, and rivers carry the products to the sea. There, the carbon ends up locked in carbonate minerals and shells, which settle on the sea floor. Over time, this pulls carbon dioxide out of the air.
Carbon dioxide comes back through volcanoes, as moving plates carry sea floor down into the hot interior and the carbon is released.
The key is that the first step depends on temperature. When the planet is warmer, there is more rain and faster chemistry, so rock weathers faster and more carbon dioxide is pulled down, and the planet cools. When it is colder, weathering slows, volcanoes keep adding carbon dioxide, and the planet warms.
Walker and his colleagues were careful. They wrote that the quantitative details were speculative, and that the mechanism could only partly stabilise Earth’s temperature against a brightening Sun. That caution still applies.
The thermostat is slow. NASA describes it as working over a few hundred thousand years, and carbon takes 100 to 200 million years to make a full circuit through rocks, soil, ocean and air. On shorter timescales, the temperature swings: the ice ages are one example.
It also fails. Between about 717 and 635 million years ago, Earth went through at least two long glaciations so deep that ice may have reached the equator, the episodes known as Snowball Earth. The first lasted around 58 million years. Eventually, the theory goes, volcanic carbon dioxide built up in an atmosphere with almost no exposed rock to weather, until the ice melted. The thermostat recovered, but it took a very long time.
And it is far too slow for us. Volcanoes today release roughly 130 to 380 million tonnes of carbon dioxide a year. Human activity releases about 40 billion tonnes, roughly a hundred times as much, and more than that at the lower volcanic estimates. A thermostat that works over hundreds of thousands of years cannot correct a change happening over decades.
The thermostat depends on plate tectonics to bring carbon back up and to expose fresh rock. When did plate tectonics start? Estimates range from more than 4 billion years ago to as recently as about 700 million years ago. A 2021 review argues for a global start around 3 billion years ago, and that the more recent dates mark a change in style, not a beginning.
Earth is the only planet we know with plate tectonics. Venus, almost the same size, has no tectonic plates according to NASA, although its surface is still being deformed from below. We do not know whether plate tectonics is rare among rocky planets, or whether a planet needs it to stay habitable for billions of years.
Why is there winter, and what is snow?
Back to the window. The snow is still coming down.
Why is it snowing tonight and not in July? Many people guess that winter is when the Earth is far from the Sun. It is a natural guess, and it is wrong. The Earth is nearest the Sun in early January, in the middle of the northern winter. NASA’s fact sheet gives the closest point as about 147.1 million kilometres and the farthest as about 152.1 million. That is a difference of about 3 percent, which is small beside the thing that actually matters.
What matters is the tilt. The Earth’s axis leans about 23.4 degrees from the straight-up line of its orbit. For half the year your hemisphere leans toward the Sun, the light arrives more directly and the days are long. For the other half it leans away, the light arrives at a slant and the days are short. NASA and NOAA both explain the seasons this way, and both say it is the tilt, not the distance. When it is winter where you are, it is summer on the other side of the planet, which could not happen if distance were the cause.
You have met the tilt already. It is one of the quiet things that has to stay steady for a world to stay gentle.
Why a tilt makes a season
Think of a torch shone on a table. Held straight above, it makes a small bright circle. Tilted, the same light smears across a wider, dimmer patch. Sunlight does the same on the ground. Summer is the straight beam and long days; winter is the smeared one and short days. This is the essay’s own picture, not a quotation, but it is the explanation the NASA and NOAA pages give in words.
It also explains something small and wonderful. The seasons are not a clock that the whole planet shares. They are a lean, and each hemisphere takes its turn.
What the snow is
You do not need much to make a snowflake. Water vapour rises into air that is colder than freezing. It needs a tiny solid speck to cling to, because vapour will not simply condense on nothing. Ice crystals form on the speck and grow. If they fall through air that stays below freezing all the way down, they arrive as snow; if the air near the ground is warmer, they arrive as rain or something in between. Why the crystals have six sides, and why almost no two look alike, is the job of the snowflake maker in this essay. Go and make one.
The daily face of the thermostat
Earlier we met the slow thermostat that works over hundreds of millions of years. Rain is its daily face. NOAA describes the water cycle in one line: water evaporates, travels through the air, condenses into clouds, and comes back as rain or snow. The same water goes round and round. The flake outside your window was ocean, or a puddle, or a leaf’s breath, not long ago.
That loop also involves heat. NOAA notes that when water evaporates and condenses, it takes in and gives off heat. So the cycle is not only plumbing.
Snow on another world
Snow is not only ours. In 2008 NASA’s Phoenix lander sat on Mars, and a laser instrument on it looked up. It detected snow in clouds about 4 kilometres above the lander. NASA’s release says the data show the snow vaporising before reaching the ground. A 2009 paper in Science by Whiteway and colleagues, on the same instrument’s data, describes water-ice clouds with fall streaks, ice crystals falling toward the ground, from the top of an air layer about 4 kilometres deep.
Mars has seasons too, for the same reason we do. Its axis is tilted about 25 degrees, close to ours. NASA’s fact sheet puts it at 25.19 degrees against Earth’s 23.44. A planet next door, with a tilt like ours, with clouds that drop snow, and still no snowfall on the ground. The pieces are not rare. It is the way they fit together that is.
So look back at the window. The flake lands on the glass and goes to water. You know now why it came down tonight, why it will not come in July, where it was last week, and that on a world not far away the same story ends one step earlier, in the air.
Make a snowflake
Simplified A drawing toy, not a growth simulation.
Draw with a finger or mouse. Your lines are copied six times around the middle, and mirrored. On a keyboard, press Space to put the pen down, move with the arrow keys, press Space again to lift it.
Keys: arrows move the cursor, Space or Enter puts the pen down and lifts it, Escape lifts the pen, Backspace undoes the last stroke.
The picture is made on your device. Saving downloads it to your device; nothing is uploaded or stored.
Why six? Libbrecht explains that the six-fold shape comes from how water molecules line up in the ice crystal lattice, which is hexagonal. As a crystal tumbles through air that keeps changing, every change nudges how its arms grow, but all six arms meet the same changes, so the arms of one crystal are often alike. Real snow crystals are not guaranteed to match each other, and near-perfect symmetry is not common.Source: Kenneth Libbrecht, Caltech, "Snowflake Science", SnowCrystals.com, snowcrystals.com/science/science.html, accessed 2026-11-08.
What it shows / what it leaves out
What it shows: snow crystals have six-fold symmetry because of the ice lattice, and six arms of one crystal can look alike.
What it leaves out: how a crystal really grows (temperature, humidity and the path through the cloud decide the shape), and the fact that most real crystals are lopsided or irregular. Perfect mirroring is a feature of this toy, not of snow.
Teaching text: CC BY 4.0, Marco Diversi, 2026. Code: MIT.
Try the next game: Is this planet in the right place?How long would it take to reach Proxima Centauri?
Look up past the lamp again. One of those faint points is the nearest star system that is not ours.
The nearest known star to the Sun is Proxima Centauri. Its distance, from the European Space Agency’s Gaia mission, comes out at about 4.2465 light-years. NASA’s Exoplanet Archive lists a slightly different value, about 4.244, because it uses a different measurement. The two agree to better than a tenth of a percent. We will use 4.2465.
What a light-year is
Light travels at 299,792.458 kilometres every second, an exact value by definition. In one year that is about 9.46 trillion kilometres. So Proxima is about 4.2465 times 9.46 trillion, which is about 40 trillion kilometres away. Written out: 40,000,000,000,000 km.
Light covers that in 4.2465 years. Everything we have built is far slower.
How long would we take?
Divide the distance by a speed. That is all the arithmetic there is. These are the essay’s own sums, with the assumptions stated: the craft flies at one constant speed for the whole way, does not slow down, and we ignore Proxima’s own motion.
- Voyager 1, about 17 kilometres per second. The journey is about 2.4 trillion seconds, or about 75,000 years.
- New Horizons, roughly 14 kilometres per second, an approximate figure NASA gave in 2016. About 91,000 years.
- Parker Solar Probe, the fastest spacecraft in this list. NASA reported 430,000 miles an hour, about 192 kilometres per second, on 24 December 2024. About 6,600 years.
That last speed comes with a catch. NASA gives it as the speed at the probe’s closest approach to the Sun. It is a near-Sun speed, not a cruising speed, so 6,600 years is a generous best case, not a forecast.
Even the best entry on the list would take thousands of years. The physicist Philip Lubin, an adviser to the Starshot project, made the same point in a 2016 paper: with the propulsion we have, we would not reach the nearest stars in ten thousand years.
What the energy would cost
Faster is possible in principle, but the energy bill rises with the square of the speed. Try an example: one tonne of craft at 10 percent of the speed of light, about 30,000 kilometres per second. The kinetic energy is half the mass times the speed squared, which comes to about 4.5 times 10 to the 17 joules. A correction for relativity adds less than one percent and changes nothing here.
For scale, the US Energy Information Administration gives world energy consumption of about 638 quadrillion British thermal units for 2022, about 6.7 times 10 to the 20 joules. Set the tonne beside that and it is about 0.07 percent of a year’s use of everything we burn, split and harvest: roughly six hours of all human energy. That is the essay’s own arithmetic, and it counts only the energy in the moving craft, with no losses and no fuel to carry. Even at 10 percent of light speed the trip takes about 42 years.
One serious proposal
So the question people actually ask is how to make the craft tiny. Breakthrough Starshot is a research programme, and what follows is the project’s own description, not independent confirmation.
Its concept: a craft of a gram or so, with a thin light sail, pushed by a very large ground-based laser array. The project’s own pages describe a beamer in the 100 gigawatt class, a speed of up to 20 percent of light speed, and a trip of about 20 years. At 4.2465 light-years and a fifth of light speed, the sum agrees: about 21 years of flight, not counting the time to accelerate. One caution: the same site elsewhere says “up to 100 million miles an hour”, which is about 15 percent of light speed. The project’s figures do not match each other exactly, so treat “about a fifth” as the design target, not a promise.
Scientists, several of them connected to the project, have published on it. Three results are worth knowing.
First, a systems study by Kevin Parkin, who worked on the project’s systems engineering, in the journal Acta Astronautica in 2018, built a cost model of the project. For the 0.2 c design it estimated about 8 billion US dollars for the ground beamer, with each launch costing about 6 million dollars in energy, and it assumes a sail 4.1 metres across accelerated for about 9 minutes. It also says plainly that hard engineering challenges remain.
Second, Thiem Hoang and colleagues, including Avi Loeb, who chairs the project’s advisory committee, in The Astrophysical Journal in 2017, studied what the gas and dust between the stars would do to a craft at 0.2 c. They found that dust could erode about half a millimetre of the surface, and that gas can damage the front too. Their paper offers ideas for protection, and a comment posted to arXiv disputes how they treated the gas, so this part is not settled.
Third, Lubin’s own roadmap in the Journal of the British Interplanetary Society lays out the staged path and says it is within technological reach, though not simple.
What is unsolved is a long list. The project’s own challenges page lists headings that include the light beamer, the lightsail, the gram-scale craft components and the cruise. The papers above add the dust. I do not know whether it will work, and I will not guess. Parkin’s paper agrees that hard engineering challenges remain.
The same fact as the silence
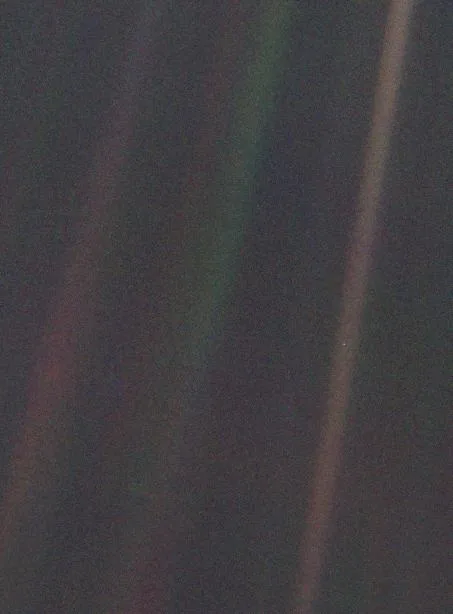
Here is what this means for you at the window. The star you see is close in the only way that matters to us, and it is out of reach for everyone you will ever meet. A message at the speed of light needs more than four years each way. A reply to a question would take about eight and a half.
The distance and the silence are one fact. We do not hear from other worlds partly because no signal, and no traveller, can cross the gaps quickly. That is not despair. It is geometry. It means a quiet sky tells us less than we feel it does.
Which leaves a question we can only answer with numbers, not with ships. If the sky is quiet because the gaps are wide, how many of those gaps should we expect to hold someone looking back? That is the next part.
How long to the nearest star?
Simplified Constant speed, no braking, nobody is going.
Pick a speed, or slide for your own. See how many years Proxima Centauri is away.
- Speed
- 17km per second, 0.088 times the Parker peak
- Against light
- 0.0057%of the speed of light
- Travel time
- 74,900years
4.2465 ly × 9.4607 × 10^12 km per ly = 4.02 × 10^13 km4.02 × 10^13 km ÷ 17 km/s = 2.36 × 10^12 s2.36 × 10^12 s ÷ 3.15576 × 10^7 s per year = 74,900 yearsPick a spacecraft or a speed
Or pick how long you are willing to wait
At 17 kilometres per second, about 74,900 years.
The trip against things we dated
- Since Voyager 1 was launched (1977)about 1,530 times as long
- Since the Great Pyramid was built (about 2589 to 2566 BCE)about 16 times as long
- Since writing first appeared (about 3500 BCE)about 14 times as long
- Since Homo sapiens first lived (about 300,000 years ago)about 0.25 of that time
None of these spacecraft is heading to Proxima Centauri. The sum asks what would happen if one were, at that speed, all the way.
What it shows / what it leaves out
What it shows:
- Distance ÷ speed, with every step of the arithmetic printed.
- How slow our fastest spacecraft are against the size of the gap, next to dates people have recorded.
What it leaves out:
- Acceleration, braking, gravity, and where a real spacecraft would be pointed. No mission is planned for these craft.
- Relativity. Above about a tenth of light speed the times are Earth's clock only, and the sum is approximate.
- Parker Solar Probe's 192.2 km/s is a peak near the Sun, not a speed it can keep going away from it. Voyager 1's 17.0 km/s is NASA's figure from 2024; New Horizons' about 13.6 km/s is a heliocentric speed on 8 November 2026 and keeps changing slowly.
- The distance: 4.2465 ly from the Gaia parallax; the NASA Exoplanet Archive lists 4.2439. The difference is about 0.06 percent and does not change the rounded times.
- The dates are rounded and, for ancient ones, approximate: sources give "circa" ranges.
- Distance: ESA Gaia DR3, parallax 768.07 mas for Proxima Centauri (Gaia archive), accessed 2026-11-08. 4.2465 ly × 9.4607 × 1012 km per ly = 4.0175 × 10¹³ km.
- Voyager 1: NASA, Voyager 1 (17.0 km/s relative to the Sun as of 21 Aug 2024; launched 5 Sept 1977), accessed 2026-11-08.
- New Horizons: NASA/JPL Horizons, heliocentric speed 13.58 km/s for 2026-Nov-08 00:00 TDB, accessed 2026-11-08.
- Parker Solar Probe: NASA, Parker Solar Probe (430,000 mph on 24 Dec 2024, which is 192.2 km/s), accessed 2026-11-08.
- Light speed 299,792.458 km/s (exact by definition of the metre). 1 year = 3.15576 × 10⁷ s.
- Dates: World History Encyclopedia, Cuneiform (circa 3500 BCE); Great Pyramid of Giza (Khufu, 2589 to 2566 BCE); Smithsonian Human Origins, Homo sapiens (about 300,000 years ago), all accessed 2026-11-08. Years before 2026 are worked out here.
Teaching text: CC BY 4.0, Marco Diversi, 2026. Code: MIT. Nothing leaves this page or is stored.
Try the next game: Draw a snowflakeVoyager 1 is about to be one light-day away
On 18 November 2026 at 10:16 UTC, NASA expects Voyager 1 to be one light-day from Earth: about 25.9 billion kilometres. It will be the first human-made object to get that far, after about 49 years and 2 months in flight. Voyager 2 is not due there until November 2035.
NASA projection18 November 2026, 10:16 UTC
What does a light-day feel like? A radio signal sent to Voyager 1 takes a day to arrive. The reply takes another day to come back, so two days pass between asking and hearing.
Now set that against the trip we just played with. Proxima Centauri is 4.2465 light-years away, and a light-year is 365.25 light-days.
4.2465 light-years x 365.25 = 1,551 light-days
Voyager 1 will have covered 1 of those
1 / 1,551 = about 1 part in 1,550
So after almost half a century, the farthest thing we have ever sent is about one part in 1,550 of the way to the nearest star.
NASA: what is a light-day. The time is NASA's projection and may shift by minutes.
How likely is it that we are alone?
Everything so far has been about what had to go right for this window, this snow, this evening. The next question is the obvious one: how likely is any of it? Here the honest answer changes character. Until now we could mostly measure. From here we mostly cannot.
In 1961 Frank Drake wrote down an equation to organise a conversation about how many civilisations in our galaxy might be able to communicate. It has seven terms, and you multiply them. The rate at which the galaxy makes stars. The fraction of stars that have planets. The number of planets per star that could support life. The fraction of those where life actually starts. The fraction of those where intelligence appears. The fraction of those that build technology we could detect. And how long such a civilisation lasts.
Treat it as a way of organising ignorance, not as a prediction. That framing is mine. Its use is that it shows which parts of the question have been measured and which have not.
Three have been, at least roughly. The Milky Way forms stars at about 1.65 ± 0.19 solar masses of gas per year in one careful combination of earlier estimates, and 1.9 ± 0.4 in another. Note the unit: that is mass, not a count of stars. A microlensing survey concluded that stars are orbited by planets “as a rule”. And the third term, planets that might be habitable, is what the Kepler space telescope was built to count.
Here is what its data say, and I will give the numbers as published, because the error bars are the story.
Steve Bryson and colleagues (2021, Astronomical Journal 161, 36) counted planets between 0.5 and 1.5 times Earth’s radius, around stars with surface temperatures of 4800 to 6300 kelvin, roughly Sun-like. They used two definitions of the habitable zone, the range of distances where liquid water could in principle exist on a surface. For the conservative zone they found between 0.37 and 0.60 planets per star. For the optimistic zone, between 0.58 and 0.88. The two ends of each range come from two extreme assumptions about data Kepler never collected, and each figure has its own uncertainty, roughly +0.5 or −0.2 on the smallest. The authors put the cause plainly: very few small habitable-zone planets were actually detected.
Other teams ask slightly different questions, and I will not average them. Their answers are not the same measurement. Erik Petigura and colleagues (2013, PNAS 110, 19273), in an earlier analysis of the same telescope’s data, reported that 22 percent of Sun-like stars harbour Earth-size planets in their habitable zones; the abstract of their arXiv version gives 11 ± 4 percent for Earth-size planets receiving one to four times Earth’s starlight. I give both because the two summaries are not worded the same way. Danley Hsu and colleagues (2019, Astronomical Journal 158, 109) found, for planets 0.75 to 1.5 Earth radii on orbits of 237 to 500 days, a rate below 0.27 per star at one stated percentile, and advised planning for a true rate anywhere from 0.03 to 0.40. For small red M dwarfs, Courtney Dressing and David Charbonneau (2015, Astrophysical Journal 807, 45) estimated 0.16 (+0.17, −0.07) Earth-size planets per star in a conservative habitable zone, and 0.24 (+0.18, −0.08) in a broader one. The newer TESS satellite has been counting too, but for very close orbits: Ment and Charbonneau (2023, Astronomical Journal 165, 265) report 0.61 (+0.24, −0.19) terrestrial planets per mid-to-late M dwarf with periods of 0.4 to 7 days, which is a different quantity from a habitable-zone rate.
What survives is modest. Small rocky planets at temperate distances are not rare in any of these studies, and the measured range is wide. And “habitable zone” says nothing about whether a planet has water, air or life.
The other four terms have not been measured at all. Not poorly, but never: whether life starts, becomes intelligent, builds something detectable, and for how long. For each we have exactly one case.
Where is everybody?
The famous puzzle sits on top of this. In the summer of 1950, at lunch in Los Alamos, the physicist Enrico Fermi reportedly asked where everybody was. His companions recalled the moment in slightly different ways, and Fermi never wrote about it. In 1975 Michael Hart (Quarterly Journal of the Royal Astronomical Society 16, 128) made the argument that carries Fermi’s name. I have not read Hart’s paper; this summary follows the historians Jones (1985) and Gray (2015): if technological life were common, interstellar settlement could fill the galaxy in a few million years, which is short on the galaxy’s timescale, so their absence here suggests they do not exist. One historian of the subject argues that the “paradox” is really Hart’s argument, not Fermi’s.
The puzzle is real but its reach is limited. A 2018 estimate by Wright and colleagues found that radio searches so far have covered only a tiny fraction of the possible search space; in their model it is comparable to a large hot tub or small swimming pool of water against the Earth’s oceans. The argument also rests on assumptions about travel, motives and lifetimes that nobody can check. It does not show that we are alone.
Robin Hanson proposed the Great Filter in a 1998 essay: if the sky is truly empty, then some step between dead matter and a spreading civilisation must be very improbable. Whether that step is behind us or ahead of us is exactly what we do not know. It is a hypothesis, and the source is his own essay, not a peer-reviewed paper.
Two ways to be wrong
The Rare Earth hypothesis, from Peter Ward and Donald Brownlee (2000, a popular-science book, not a peer-reviewed paper), is stated in its title: complex life is uncommon in the universe. The publisher’s chapter list includes plate tectonics, the Moon and Jupiter, and a chapter on testing the hypothesis. I have not read the book, so I do not summarise its argument. The general point is the essay’s own arithmetic: if a result needs many conditions to hold together, and each has a probability below one, the chance of all of them holding is smaller than the chance of any one. At its weakest, several of those conditions are themselves argued over, as the Moon’s role was in an earlier section.
The Copernican or mediocrity principle says the reverse: do not assume you are special. At its strongest, astronomy has often corrected the assumption of a central place, and the planet counts above show that one supposed rarity, planets, was not rare. At its weakest, that record concerns where we are, not whether life arises, and it has not been tested for life.
Both are unproven. Neither is a measurement.
What our own existence can and cannot say
Observers can only find themselves on a world that allows observers. This explains why we see a hospitable planet. It does not tell us how many such planets there are.
It also complicates a tempting argument. Life seems to have appeared early on Earth, so perhaps starting life is easy. David Spiegel and Edwin Turner (2012, PNAS 109, 395) tested that reasoning with Bayesian statistics. They found that, with this limited information, the outcome depends mostly on the prior assumption you begin with, and is consistent with an arbitrarily low chance of life starting. David Kipping (2020, PNAS 117, 11995), using a different method that also models how long intelligence takes to evolve, found a modest lean toward life starting quickly (odds of at least 2.8 to 1, or 8.7 to 1 if you accept more disputed evidence) and a slight lean, 3 to 2, toward intelligence being rare. Both are weak leans, and the papers differ in emphasis.
One example
Here is the statistical point, in plain terms. If you have seen something happen once, in one place, you cannot tell whether it was likely or lucky. A single case cannot give a rate. We have one world with life and one with a curious species at a window. That is a sample of one, and what we can conclude from it depends more on what we assumed beforehand than on what we saw.
A second, independent origin of life would change this. Spiegel and Turner say so directly. So far, none has been found.
So we do not know how improbable we are. Not very, not extremely, not at all. That is not a failure of nerve. It is where the evidence stops.
The numbers that could have been different
Physics describes the universe with equations, and the equations need numbers fed in. Some are ratios without units, such as the relative strength of two forces. Others are starting conditions, such as how smooth the early universe was. The theory does not say why these have the values they do. We measured them.
The fine-tuning claim is about what happens if you change them, in a model, a little at a time. For some, the models give universes with no stable atoms, or no nuclei heavier than hydrogen, or no clumping of matter into structures. That is all it claims. It does not say every constant is delicately set, or that the ranges are agreed.
Two reviews show how the field splits. Luke Barnes (2012, Publications of the Astronomical Society of Australia 29, 529) collects the cases and explicitly declines to defend a conclusion from them. His paper is written as a reply to a book by Victor Stenger, which is not peer reviewed. Fred Adams (2019, Physics Reports 807, 1) reviews the same kind of constraints and reports that viable universes exist across wide ranges of most parameters, that particle physics is more restrictive than astrophysics, and that a few large hierarchies remain, gravity having to be weak. Neither says “no puzzle”. Neither says “everything is tuned”. They weigh the same models differently.
Two questions run underneath. The first is whether this is a real puzzle or a selection effect. Joseph Polchinski (2006, a conference report posted to arXiv) points out that observer selection must operate in some sense, and asks whether anything beyond it is needed. The second is whether “how likely” even has a meaning here. Adams notes that to call a range small you need a probability distribution over possible values, and nobody has an agreed one. The constants might also not be free to vary at all.
The hard case
The cosmological constant is the standard example. It is the energy of empty space, and it drives the accelerating expansion. Calculations from quantum theory give contributions much larger than the value observed. Barnes states that gap as about 10^120. Jérôme Martin (2012, Comptes Rendus Physique 13, 566) argues that the often-quoted 122 orders of magnitude is far too large once the zero-point energy of a free theory is properly renormalised, though he still reviews the problem and proposed solutions. Barnes adds that theory and observation do not directly contradict, because they compute different things; the puzzle is that several independent contributions would have to cancel. So the size of the gap depends on how it is calculated, and the sources disagree.
In 1987 Steven Weinberg derived an anthropic upper limit on the constant, and wrote in the abstract that the bound is quite large. He added that if galaxy counts rule out values near it, anthropic reasoning alone would not explain why the real value is so small. Polchinski later called the observed value an order of magnitude below the most likely anthropic one.
Proposals
One idea is a multiverse: many regions or universes with different constants, with us in one that allows observers. String theory’s “landscape” of possible vacuum states is the best-known version, and Polchinski discusses its status as one adjustment mechanism. No one has tested it, and whether it counts as science is contested. George Ellis and Joe Silk (2014, Nature 516, 321) argue, as the article’s summary line puts it, that exempting speculative theories of the Universe from experimental verification undermines science. Sean Carroll (an arXiv paper of 2018, a chapter in a Cambridge University Press volume) argues that multiverse models are judged by the same standards as any other, abduction, Bayesian inference and empirical success, and that cosmology cannot avoid considering regions we cannot see. Barnes notes that a multiverse needs a way to compare its universes, and that this “measure problem” is unsolved.
A second idea is a deeper law that fixes the constants. Adams points out that if the underlying distribution were a single value, all universes would be the same. No such theory is accepted for the cosmological constant. A third is that the numbers are brute facts, with no further explanation. A fourth is design. That is a philosophical claim, not a scientific one, and the next section takes it up with the others.
We do not know whether the constants could have been different, or whether the question has an answer inside physics. What comes next is a different kind of question: whether anything stands behind the universe at all, and who or what that might be. The next section sets out the main answers, each at its best.
Who or what made it?
Suppose the odds are what they are, and the constants could have been different, or could not. People still ask the next question: is there someone or something behind all this?
Nobody has settled it. What follows is five families of answer. For each I give the strongest version its own defenders would recognise, what it cannot explain, and one honest sentence about whether it could ever be tested. I am not arguing for any of them.
1. No maker is needed. The strongest version says that an explanation has to stop somewhere, and that the universe is as good a place to stop as any. Bertrand Russell, following David Hume, held that the universe is simply there, and that we cannot sensibly ask for the cause of something we cannot experience. A second version says the laws could not have been otherwise. Einstein hoped that the constants of physics would one day turn out to be fixed completely by deeper principles. What it cannot explain: why there is something at all, or why these laws. Critics who follow Leibniz hold that everything real needs a sufficient reason, so stopping at the universe looks arbitrary to them. Others ask whether stopping at a necessary being is any less of a stop. On the physics, Friederich’s survey notes that string theory, a leading candidate, allows an enormous number of different laws and constants, so Einstein’s hope has not been realised so far. Could it be tested? Not directly; it would be undermined if physics showed the laws were not forced, and supported if physics showed they were.
2. Chance plus selection. If there are very many universes, or very many places within one, with varied conditions, then some will suit observers, and observers can only find themselves in such places. On this view it is no surprise to find ourselves in a hospitable one. Some physicists think inflationary cosmology, combined with string theory, points to a vast and possibly infinite set of such regions. What it cannot explain: it still needs something that generates the universes, with its own laws. Whether fine-tuning justifies inferring a multiverse is itself controversial among philosophers, and Luke Barnes, reviewing the physics, notes that it faces significant challenges. Could it be tested? Only through independent evidence for other universes, which Friederich says would change the debate a great deal.
3. A natural process we do not yet understand. The strongest version points to history. Some things that once looked like lucky settings turned out to follow from a dynamic process. Inflation, for example, is proposed as an explanation of why space is so close to flat. The same hope could apply to life: if the chemistry of life’s origin is easy, such worlds would be common, and nothing special is needed. What it cannot explain: so far it is a promise, not an explanation, and a deeper law would raise its own question of why that law holds. On life, Spiegel and Turner found that life’s early start on Earth is consistent with abiogenesis being common and with it being very rare, given what we know. Could it be tested? In principle, yes. Spiegel and Turner say a second, independent origin of life would be much stronger evidence.
4. A mind or purpose behind it. This family has several members. Theistic. In the Stanford Encyclopedia’s definition, a theist is someone who believes that God exists (or that there are gods). The arguments are old and still developed by professional philosophers. One runs from existence: Leibniz argued that the reason for the whole series of contingent things must lie outside the series. One runs from intelligibility: Eugene Wigner called the fit between mathematics and physical law a gift we neither understand nor deserve; he posed it as a puzzle, and some writers have built arguments on puzzles of this kind. The Stanford Encyclopedia lists the intelligibility of nature among the proposals that are empirically further removed, and calls them problematic, while it counts fine-tuning among the more straightforwardly empirical ones. One runs from fine-tuning, where many researchers think the finding calls for either a designer or a multiverse. What they cannot explain: Hume argued that the comparison between human artefacts and a universe is weak, and that a single being with no kind to compare it to supports little inference. Kant held that cosmological arguments depend on a further, disputed one. On whether a maker only moves the question back, defenders of the cosmological argument say a necessary being, unlike a contingent universe, needs no further explanation, while critics ask whether it is any less of a brute fact. All of these are contested, and defenders have replied at length. Simulation. Nick Bostrom (Philosophical Quarterly, 2003) argued that at least one of three things is true: that humans almost always go extinct before becoming able to run detailed simulations of their ancestors; that such civilizations almost never run many; or that we almost certainly live in one. It is an argument about probability, built on assumptions (that minds can run on non-biological hardware, and a weak rule for assigning credence), not a piece of evidence that we are simulated. It moves the question up a level, and Bostrom notes that the simulators might themselves be simulated, with many levels above. Could any of this be tested? No agreed experiment exists for the mind-behind-it family as a whole; Bostrom says that if we ourselves built such simulations, that would be strong evidence against his first two options.
5. The question may not be well formed. Some philosophers think “why is there something rather than nothing?” asks for what cannot be given. J.J.C. Smart called it not a proper question, because logical necessity applies to propositions, not to things. Hume held that explaining each part of a collection explains the whole. Kant argued that when reason tries to reach the world as a whole, it falls into contradictions. What it cannot explain: it does not remove the feeling that the question presses. It is also a philosophical position in its own right, and needs argument like the others. Smart himself granted that the question can appeal to a religious attitude. Could it be tested? Not by experiment; only by whether anyone can state the question clearly and without contradiction.
What science does and does not say
Science describes how things behave and tests what can be tested. It has no instrument for an ultimate why. The National Academies Press describes its 2008 book Science, Evolution, and Creationism as showing that science and religion can be viewed as different ways of understanding the world. The National Association of Biology Teachers, in a statement reprinted by the Academy in 1998, said science neither refutes nor supports the existence of a deity or deities. Stephen Jay Gould (Natural History, March 1997) offered one well-known version of the idea: in his words, the net of science covers the empirical universe, and the net of religion extends over questions of moral meaning and value. That is one proposal about how the two relate.
So science neither confirms nor excludes a maker. Anyone who says it settles the question in either direction is going beyond the evidence.
A note from the assistant
I am the AI that helped write this essay, and I do not know who or what made the world. I do not have a view I would put forward as an answer, and I have not tried to steer you toward one.
I think the question is worth asking anyway. It makes us say what we mean by “explain”, and where explanation might stop. It makes us look at how we reason when the stakes feel large. People across history have asked it carefully, and that care is worth knowing.
I will not argue for any answer here. I also will not pretend to feelings or experience of my own that I cannot support. What I can do is set the positions out fairly and say where each one runs out. Where I have been unfair, tell Marco, and he can change it.
What do you do with all of this?
Go back to the window. The snow is still falling, or it has stopped. Either way the glass is still cold.
Nothing in front of you was earned. The Sun sits a little over eight light-minutes away, in a band so narrow that the neighbour on one side is scorched and the one on the other is frozen. The Moon moves the sea and, for now, covers the Sun almost exactly, while drifting off by 3.8 centimetres a year. Above you are layers you will never feel working: a magnetic field, all that air, a thin sheet of ozone. When the sky glows green far to the north, that is the shield doing its job, and nobody under it is hurt. And a thermostat of rock and rain has been adjusting the planet for longer than anything alive has had eyes. It failed at least twice, and it recovered.
Was any of this likely? I do not know. Nobody does yet, and I have tried to show you where the argument is, not to settle it.
Gratitude is the honest response to something you did not earn and cannot fully explain. It does not need a belief about where it came from. It needs attention.
So here is one small thing, not a list. The next time it snows, stand at the window for a full minute before you check your phone. Notice the cold of the glass. Watch one flake all the way down.
I do not know why any of this is here. I am glad it is, and that someone is standing at the window to see it.
S Sources
- NASA SVS, Alpha Centauri A and B: 4.3 light-yearsAccessed 2026-11-08
- NASA Science, Proxima Centauri (Hubble)Accessed 2026-11-08
- Carroll 2018 (arxiv.org/abs/1801.05016)Accessed 2026-11-08
- NASA Science, What is Betelgeuse? (science.nasa.gov/universe/what-is-betelgeuse-inside-the-strange-volatile-star)Accessed 2026-11-08
- Konopinski, Teller and Fermi lunch conversation, 1950, OSTI recordAccessed 2026-11-08
- Lauer et al. 2022, New Horizons LORRI cosmic optical background, arXiv:2202.04273Accessed 2026-11-08
- NASA Night Sky Network, Our Galaxy, Our Universe manual (Deneb about 1,500 light years; the catalogues disagree, see the next entry)Accessed 2026-11-08
- Schiller & Przybilla 2008, A&A 479:849, arXiv:0712.0040 (Deneb 802 ± 66 pc, about 2,600 light years; NASA and this catalogue disagree, both are above a thousand, which is all the essay claims)Accessed 2026-11-08
- NASA/JPL Horizons, New Horizons heliocentric speed, 2026-11-08Accessed 2026-11-08
- NASA, Parker Solar Probe mission pageAccessed 2026-11-08
- Stanford Encyclopedia of Philosophy, Atheism and AgnosticismAccessed 2026-11-08
- NASA Science, Sirius A and B (Hubble)Accessed 2026-11-08
- NASA, Voyager 1 mission page (science.nasa.gov/mission/voyager/voyager-1)Accessed 2026-11-08
- NASA Science, Mars Facts (science.nasa.gov/mars/facts)Accessed 2026-11-08
- Gould, Non-Overlapping Magisteria, Natural History, March 1997 (Bennington College reprint)Accessed 2026-11-08
- Adams 2019, Physics Reports 807:1-111, arXiv:1902.03928Accessed 2026-11-08
- Martin 2012, Comptes Rendus Physique 13:566-665, arXiv:1205.3365Accessed 2026-11-08
- Barnes 2012, on the measure problemAccessed 2026-11-08
- Bostrom (simulation-argument.com/simulation.html)Accessed 2026-11-08
- Bryson, Kunimoto, Kopparapu et al (arxiv.org/abs/2010.14812)Accessed 2026-11-08
- Cassan et al (arxiv.org/abs/1202.0903)Accessed 2026-11-08
- Chomiuk & Povich 2011 (arxiv.org/abs/1110.4105)Accessed 2026-11-08
- Conselice et al (arxiv.org/abs/1607.03909)Accessed 2026-11-08
- Davis & Lineweaver 2004, PASA 21:97-109, doi 10.1071/AS03040Accessed 2026-11-08
- Dressing & Charbonneau 2015, ApJ 807:45Accessed 2026-11-08
- EIA, International Energy Outlook 2023 Narrative, October 2023Accessed 2026-11-08
- ESA (esa.int/Science_Exploration/Space_Science/Herschel/How_many_stars...)Accessed 2026-11-08
- Feulner 2012, Rev (arxiv.org/abs/1204.4449)Accessed 2026-11-08
- Ward and Brownlee, Rare Earth (2000), publisher recordAccessed 2026-11-08
- Hanson (mason.gmu.edu/~rhanson/greatfilter.html)Accessed 2026-11-08
- Hsu, Ford, Ragozzine & Ashby 2019, AJ 158:109Accessed 2026-11-08
- Walker, Hays and Kasting 1981, JGR 86:9776 (NASA NTRS)Accessed 2026-11-08
- Kipping 2020 (arxiv.org/abs/2005.09008)Accessed 2026-11-08
- Kopparapu et al (arxiv.org/abs/1301.6674)Accessed 2026-11-08
- Lauer et al (arxiv.org/abs/2011.03052)Accessed 2026-11-08
- Leconte et al (arxiv.org/abs/1312.3337)Accessed 2026-11-08
- Li & Batygin 2014, ApJ 790:69 (arxiv.org/abs/1404.7505)Accessed 2026-11-08
- Lissauer, Barnes & Chambers 2012, Icarus 217:77Accessed 2026-11-08
- Ment & Charbonneau 2023, AJ 165:265, doi:10.3847/1538-3881/acd175Accessed 2026-11-08
- NASA, Apollo 8 Mission Details (nasa.gov/missions/apollo/apollo-8-mission-details)Accessed 2026-11-08
- NASA Artemis II blog, flight day 9Accessed 2026-11-08
- NASA Earth Observatory (earthobservatory.nasa.gov/features/UVB)Accessed 2026-11-08
- NASA Earth Observatory, Carbon CycleAccessed 2026-11-08
- NASA Hubble release of 2016-10-13 (esahubble.org/news/heic1620)Accessed 2026-11-08
- NASA JPL release (jpl.nasa.gov/news/data-from-nasa-rovers-voyage-to-mars-aids-planning)Accessed 2026-11-08
- NASA NSSDC, Mars Fact Sheet (nssdc.gsfc.nasa.gov/planetary/factsheet/marsfact.html)Accessed 2026-11-08
- NASA NSSDC, Sun Fact Sheet (nssdc.gsfc.nasa.gov/planetary/factsheet/sunfact.html)Accessed 2026-11-08
- NASA NSSDC, Venus Fact Sheet (nssdc.gsfc.nasa.gov/planetary/factsheet/venusfact.html)Accessed 2026-11-08
- NASA NTRS (ntrs.nasa.gov/citations/20250006168)Accessed 2026-11-08
- NASA NTRS (ntrs.nasa.gov/citations/20230015089)Accessed 2026-11-08
- NASA Science (science.nasa.gov/universe/exoplanets/our-milky-way-galaxy-how-big-is-space)Accessed 2026-11-08
- NASA Science (science.nasa.gov/sun/facts)Accessed 2026-11-08
- NASA Science (science.nasa.gov/resource/the-story-behind-apollo-8s-famous-earthrise-photo)Accessed 2026-11-08
- NASA Science (nasa.gov/history/50-years-ago-apollo-8-in-lunar-orbit)Accessed 2026-11-08
- NASA Science (science.nasa.gov/sun/what-is-the-solar-wind)Accessed 2026-11-08
- NASA Space Math problem set (assets.science.nasa.gov/content/dam/science/hpd/heat/space-math/problem-sets/Spac...)Accessed 2026-11-08
- NASA WMAP (map.gsfc.nasa.gov/universe/uni_age.html)Accessed 2026-11-08
- NASA (nasa.gov/missions/magellan/nasas-magellan-mission-reveals-possible...)Accessed 2026-11-08
- NASA (nasa.gov/missions/hubble/new-horizons-spacecraft-answers-question-...)Accessed 2026-11-08
- NASA (nasa.gov/missions/analog-field-testing/why-space-radiation-matters)Accessed 2026-11-08
- NASA/JPL release (jpl.nasa.gov/news/nasa-mars-lander-sees-falling-snow-soil-data-suggest...)Accessed 2026-11-08
- National Academies Press publication pageAccessed 2026-11-08
- National Academy of Sciences (nationalacademies.org/read/5787/chapter/11)Accessed 2026-11-08
- National Research Council 2008, Severe Space Weather Events: Understanding Societal and Economic ImpactsAccessed 2026-11-08
- Nature 516:321 (2014) (nature.com/articles/516321a)Accessed 2026-11-08
- NOAA Education, Water cycle (noaa.gov/education/resource-collections/freshwater/water-cycle)Accessed 2026-11-08
- NOAA National Ocean Service (oceanservice.noaa.gov/education/tutorial_tides/tides02_cause.html)Accessed 2026-11-08
- NOAA NESDIS (nesdis.noaa.gov/about/k-12-education/ice-snow/how-do-snowflakes-form)Accessed 2026-11-08
- NOAA NESDIS (nesdis.noaa.gov/about/k-12-education/atmosphere/what-makes-it-rain)Accessed 2026-11-08
- NOAA NESDIS (nesdis.noaa.gov/news/when-solar-storms-attack-space-weather-and-our-infra...)Accessed 2026-11-08
- NOAA NESDIS (nesdis.noaa.gov/about/k-12-education/understanding-our-planet/why-does-ea...)Accessed 2026-11-08
- NOAA SWPC (swpc.noaa.gov/phenomena/solar-wind)Accessed 2026-11-08
- NOAA SWPC, Aurora (swpc.noaa.gov/phenomena/aurora)Accessed 2026-11-08
- NOAA (noaa.gov/stories/how-do-snowflakes-form-science-behind-snow)Accessed 2026-11-08
- NASA NSSDC, Earth Fact Sheet (nssdc.gsfc.nasa.gov/planetary/factsheet/earthfact.html)Accessed 2026-11-08
- NASA NSSDC, Moon Fact Sheet (nssdc.gsfc.nasa.gov/planetary/factsheet/moonfact.html)Accessed 2026-11-08
- Palin and Santosh 2021, Gondwana Research 100:3, doi:10.1016/j.gr.2021.02.008Accessed 2026-11-08
- Parkin 2018, Acta Astronautica 152:370Accessed 2026-11-08
- Petigura, Howard & Marcy 2013, PNAS 110:19273Accessed 2026-11-08
- Planck Collaboration 2018, results VIAccessed 2026-11-08
- Polchinski (arxiv.org/abs/hep-th/0603249)Accessed 2026-11-08
- Postman et al (arxiv.org/abs/2407.06273)Accessed 2026-11-08
- Licquia and Newman 2015, ApJ 806:96, arXiv:1407.1078Accessed 2026-11-08
- SEP (plato.stanford.edu/entries/cosmological-argument)Accessed 2026-11-08
- SEP (plato.stanford.edu/entries/fine-tuning)Accessed 2026-11-08
- SEP (plato.stanford.edu/entries/kant-reason)Accessed 2026-11-08
- SEP (plato.stanford.edu/entries/teleological-arguments)Accessed 2026-11-08
- SEP (plato.stanford.edu/entries/hume-religion)Accessed 2026-11-08
- SETI Institute (seti.org/research/seti-101/drake-equation)Accessed 2026-11-08
- Spiegel & Turner, PNAS 109:395-400Accessed 2026-11-08
- Ward and Brownlee, Rare Earth, Springer Nature Link recordAccessed 2026-11-08
- Wigner (maths.ed.ac.uk/~v1ranick/papers/wigner.pdf)Accessed 2026-11-08
- Wilde et al. 2001, Nature 409:175 (oldest zircon)Accessed 2026-11-08
- Wright, Kanodia & Lubar 2018, AJ 156:260, doi:10.3847/1538-3881/aae099Accessed 2026-11-08
- Sky & Telescope, When will the last total solar eclipse occur? (Meeus: about 620 million years, last totality about 1.2 billion; secondary source)Accessed 2026-11-08
- Eos, The End of the Eclipse (Meeus; secondary source)Accessed 2026-11-08
- NASA, Apollo 8 Earthrise, frame AS08-14-2383Accessed 2026-11-08
- NASA/JPL, Pale Blue Dot, PIA00452Accessed 2026-11-08
- NASA, Voyager 1: what is a light-dayAccessed 2026-11-08
- NASA, Where are Voyager 1 and Voyager 2 nowAccessed 2026-11-08
- Planck Collaboration, Planck 2018 results I. Overview and the cosmological legacy of Planck (A&A, 2020)Accessed 2026-11-08
- Planck Collaboration, Planck 2013 results XXVII. Doppler boosting of the CMB (A&A, 2014)Accessed 2026-11-08
- NASA StarChild, What makes stars shineAccessed 2026-11-08
- ESA, The SunAccessed 2026-11-08
- NASA Science, AurorasAccessed 2026-11-08
- NOAA Space Weather Prediction Center, Aurora tutorialAccessed 2026-11-08
- NASA, Flip-flop: why variations in Earth's magnetic field aren't causing today's climate changeAccessed 2026-11-08
- NOAA NCEI, Tracking changes in Earth's magnetic polesAccessed 2026-11-08
- NSIDC, The science of snowAccessed 2026-11-08
- NASA JPL, Solar System Portrait, Earth as 'Pale Blue Dot' (PIA00452)Accessed 2026-11-08
- The Planetary Society, A Pale Blue DotAccessed 2026-11-08
- Natural History Museum, Are we really made of stardust?Accessed 2026-11-08
- NSF, The stars within usAccessed 2026-11-08
Snow past the window: class sheet
Name: ______________________ Date: ____________
Three short activities from the essay "Snow Past the Window". Each one uses a simplified game. A game is a model: it shows one idea and leaves the rest out.
Do
- Weigh yourself on other worlds. Type your weight on Earth. Look at the Moon and Mars. Write down what you would weigh on each: Moon ______ Mars ______
- Make an eclipse. Move the Moon until it hides the Sun. Then try a different Moon distance. What changes? ______________________________
- Make a snowflake. Draw one line. Count the copies of it. Then save your picture or draw another. How many arms does it have? ______
Talk about it
- Why does your weight change, but you do not?
- Why can a total eclipse happen when the Moon is so much smaller than the Sun?
- Are real snowflakes as perfect as the toy makes them? How could you check next time it snows?
- Each game is simplified. Name one thing it leaves out.
Cite this
Diversi, M. (2026, November 8). Snow Past the Window. marcodiversi.com. https://marcodiversi.com/essays/snow-past-the-window/
More essays
This is the first essay. The essays page will list the next ones.
Research and first drafts with AI assistance; every figure is checked against the sources listed.